Step-by-Step Guide to Job Evaluation and Salary Structure Design
Learn how to build a fair and competitive compensation system from scratch with this comprehensive step-by-step guide that covers all four job evaluation methods (point factor, ranking, classification, and market pricing), complete with real-world examples, detailed formulas, and a full case study.
HUMAN RESOURCES
11/18/202517 min read


Creating a fair and competitive salary structure is essential for attracting talent, maintaining equity, and controlling compensation costs. This comprehensive guide walks you through the entire process with a practical example.
What is Job Evaluation?
Job evaluation is a systematic process of determining the relative worth of jobs within an organization. It helps establish internal equity by comparing jobs based on their responsibilities, required skills, and contributions to organizational goals—not on the people performing them.
Why You Need a Structured Approach
Without a formal salary structure, organizations face:
Pay inequities leading to employee dissatisfaction.
Difficulty justifying compensation decisions
Challenges in recruiting competitively
Potential legal compliance issues
Budget overruns and inconsistent pay practices
Steps in Conducting Job Evaluation and Salary Structure Design
Step 1: Prepare for Job Evaluation
Action Items:
Form a compensation committee (HR, finance, department heads)
Communicate the project to stakeholders.
Select your evaluation method.
Gather existing job descriptions.
Timeline: 2-3 weeks
The committee should include people who understand various roles across the organization. Their diverse perspectives ensure fair evaluations.
Step 2: Update or Create Job Descriptions
What to Include:
Job title and department
Reporting relationships
Primary responsibilities and duties
Required qualifications (education, experience, certifications)
Key competencies and skills
Working conditions and physical requirements
Best Practice: Use consistent formatting and focus on the job, not the incumbent. Interview managers and employees to ensure accuracy.
Step 3: Choose Your Job Evaluation Method
Selecting the proper job evaluation method is critical to your structure's success. Each approach has distinct advantages, limitations, and ideal use cases. Here's a detailed examination of the four most common methods:
Method 1: Point Factor Method (Most Widely Used)
Overview: The point factor method is the most sophisticated and defensible approach to job evaluation. It breaks down jobs into compensable factors (skill, responsibility, effort, working conditions), assigns point values to different levels of each factor, and totals the points to determine a job's relative worth.
How It Works:
Select Compensable Factors - Identify 4-8 factors that drive value in your organization.
Define Factor Degrees - Create 3-6 levels for each factor with clear descriptions.
Assign Point Values - Distribute total available points across factors and degrees
Weight Factors - Allocate more points to more important factors
Evaluate Jobs - Score each job on every factor
Total Points - Sum all factor scores to get the job's total point value
Detailed Example:
Let's say you're evaluating a "Marketing Manager" position with these four factors:
Factor 1: Education & Experience (Max 250 points - 25% weight)
Degree 1 (50 pts): High school + 2 years
Degree 2 (100 pts): Associate's + 4 years
Degree 3 (150 pts): Bachelor's + 5 years ← Marketing Manager scores here
Degree 4 (200 pts): Bachelor's + 8 years or Master's + 5 years
Degree 5 (250 pts): Master's + 10 years or PhD
Factor 2: Supervisory Responsibility (Max 200 points - 20% weight)
Degree 1 (40 pts): No supervision
Degree 2 (80 pts): Supervises 1-2 employees
Degree 3 (120 pts): Supervises 3-7 employees ← Marketing Manager scores here
Degree 4 (160 pts): Supervises 8-15 or manages managers
Degree 5 (200 pts): Supervises 15+ or multiple management layers
Factor 3: Decision-Making Impact (Max 300 points - 30% weight)
Degree 1 (60 pts): Follows procedures, minimal discretion
Degree 2 (120 pts): Some independent decisions within guidelines
Degree 3 (180 pts): Significant decisions affecting the department ← Marketing Manager scores here
Degree 4 (240 pts): Major decisions affecting multiple departments
Degree 5 (300 pts): Strategic decisions affecting the entire organization
Factor 4: Budget Responsibility (Max 250 points - 25% weight)
Degree 1 (50 pts): No budget responsibility
Degree 2 (100 pts): Influences spending up to $50K
Degree 3 (150 pts): Manages budget $50K-$250 ← Marketing Manager scores here
Degree 4 (200 pts): Manages budget $250K-$1M
Degree 5 (250 pts): Manages budget over $1M
Marketing Manager Total: 150 + 120 + 180 + 150 = 600 points
Advantages:
Most objective and defensible - Reduces bias and provides a clear rationale for pay differences
Legally defensible - Well-documented methodology helps with equal pay compliance
Flexible and customizable - Can tailor factors to your organization's values
Consistent across diverse jobs - Works for comparing vastly different positions
Transparent - Easy to explain how job values were determined
Supports internal equity - Creates clear job hierarchies
Disadvantages:
Time-intensive - Initial setup takes 2-4 months for a comprehensive system
Requires expertise - Need trained evaluators who understand the methodology
Can be complex - May be overwhelming for small organizations
Maintenance required - Factors may need updating as business changes
Potential for over-engineering - Risk of making it too complicated
Best For:
Medium to large organizations (100+ employees)
Companies with diverse job families (technical, sales, operations, admin)
Organizations needing legal defensibility
Companies committed to internal equity
Unionized environments where transparency is critical
Method 2: Job Ranking Method (Simplest Approach)
Overview: Job ranking is the most straightforward evaluation method. Evaluators rank all jobs from most to least valuable based on their overall contribution to the organization. Think of it as creating a simple list from "most important" to "least important."
How It Works:
Gather Job Information - Collect descriptions for all positions
Select Evaluators - Typically, senior management and HR
Rank Jobs - Order jobs from highest to lowest value
Resolve Disagreements - Discuss until consensus is reached
Group into Grades - Cluster similarly-ranked jobs together
Assign Salary Ranges - Apply market data to groups
Detailed Example:
A 40-person consulting firm ranks its positions:
Rank 1-5 (Executive Level):
Managing Partner
Chief Operating Officer
Chief Financial Officer
Senior Partner
Partner
Rank 6-12 (Senior Professional): 6. Senior Consultant 7. Consultant Manager 8. Senior Project Manager 9. HR Director 10. Finance Manager 11. Marketing Manager 12. IT Manager
Rank 13-25 (Professional Level): 13. Consultant 14. Project Manager 15. Senior Analyst 16. HR Generalist 17. Senior Accountant 18. Marketing Specialist (and so on...)
Rank 26-40 (Support Level): 26-35. Various administrative and support roles 36-40. Entry-level positions
They then group these into six salary grades based on natural clustering:
Grade 6: Ranks 1-5
Grade 5: Ranks 6-12
Grade 4: Ranks 13-18
Grade 3: Ranks 19-25
Grade 2: Ranks 26-35
Grade 1: Ranks 36-40
Variations:
Paired Comparison Method: Compare each job to every other job (Job A vs. Job B, Job A vs. Job C, etc.). The job that "wins" more comparisons ranks higher. Works well with up to 20 jobs.
Example with five jobs:
Job A beats Jobs B, C, D, E = 4 points (Rank #1)
Job B beats Jobs C, E = 2 points (Rank #2)
Job C beats Job E = 1 point (Rank #3)
Job D beats Jobs C, E = 2 points (Rank #2 tied)
Job E beats none = 0 points (Rank #5)
Alternation Ranking: Start by identifying the highest-value job, then the lowest. Next, identify the second-highest, then the second-lowest, and continue alternating until all jobs are ranked.
Advantages:
Simple and fast - Can be completed in days, not months
Low cost - Requires minimal resources or external expertise
Easy to understand - Everyone grasps the concept of ranking
No complex calculations - Just discussion and consensus
Good starting point - Can transition to more sophisticated methods later
Works with limited data - Doesn't need detailed factor analysis
Disadvantages:
Highly subjective - Based on opinions, not objective criteria
Difficult to justify - Hard to explain why Job A ranks higher than Job B
Not legally defensible - Vulnerable to discrimination challenges
Poor for large organizations - Becomes unwieldy with 50+ jobs
Ranking disagreements - Different evaluators may have vastly different views
Ignores job differences - Doesn't show how much more valuable one job is than another
Perpetuates biases - May reflect existing prejudices about "women's work" or other factors
Best For:
Small organizations (under 50 employees)
Startups needing a quick solution
Organizations with minimal resources
Homogeneous workforce (similar types of jobs)
Short-term solution before implementing a more robust system
Companies where jobs are well-understood by leadership
Cost & Time Investment:
Setup: $0-$5,000 (can be done internally)
Timeline: 1-3 weeks
Maintenance: 10-20 hours annually
Warning: This method is rarely used alone in modern compensation practice due to its subjectivity and legal vulnerabilities. Consider it a stepping stone, not a destination.
Method 3: Job Classification Method (Grade Description Approach)
Overview: The classification method creates predefined grade levels with detailed descriptions, then assigns each job to the grade that best matches its requirements. It's similar to "sorting" jobs into buckets based on their characteristics. The U.S. Federal Government's GS (General Schedule) system is the most famous example.
How It Works:
Define Number of Grades - Typically 8-15 levels based on organizational hierarchy.
Write Grade Descriptions - Create detailed narratives describing typical jobs at each level
Establish Grade Factors - Include skill, responsibility, complexity, and supervision for each grade
Evaluate Jobs - Read each job description and match it to the best-fitting grade
Review and Adjust - Ensure logical placement across the organization.
Assign Salary Ranges - Apply market data to each grade
Detailed Example:
A hospital system creates eight grades with these descriptions:
Grade 1 - Entry Level Support Typical Jobs: Housekeeper, Food Service Worker, Transporter
Education: High school diploma or equivalent
Experience: 0-1 year, on-the-job training provided
Supervision Received: Close, direct supervision with detailed instructions
Decision Making: Follows established procedures, minimal discretion
Responsibility: Individual tasks with immediate impact
Typical Duties: Routine, repetitive work requiring basic skills
Grade 3 - Skilled Support Typical Jobs: Medical Records Clerk, Patient Scheduling Coordinator, Pharmacy Technician
Education: High school diploma plus specialized training or certification
Experience: 2-3 years related experience
Supervision Received: General supervision, works within established procedures
Decision Making: Some independent judgment within guidelines
Responsibility: Affects department operations, interacts with patients/visitors
Typical Duties: Semi-routine work requiring specialized knowledge
Grade 5 - Professional Typical Jobs: Registered Nurse, Medical Lab Technologist, Physical Therapist
Education: Bachelor's degree and professional license/certification required
Experience: 3-5 years of clinical or professional experience
Supervision Received: Works independently with periodic review
Decision Making: Substantial independent judgment, clinical decision-making
Responsibility: Direct impact on patient care and outcomes
Typical Duties: Complex professional work requiring specialized expertise
Grade 7 - Senior Professional/Manager Typical Jobs: Nurse Manager, Department Supervisor, Senior Therapist
Education: Bachelor's degree required, Master's preferred
Experience: 7-10 years with demonstrated leadership
Supervision Received: Minimal supervision, self-directed
Decision Making: Significant authority within department, policy interpretation
Responsibility: Manages staff (5-15 people) and/or major programs
Typical Duties: Complex management or advanced specialized work
Grade 8 - Executive Typical Jobs: Chief Nursing Officer, Director of Operations, VP of Patient Services
Education: Master's degree or equivalent required
Experience: 10+ years with extensive leadership experience
Supervision Received: Works under broad objectives and goals
Decision Making: Strategic decisions affecting multiple departments or the entire organization
Responsibility: Senior leadership, large budgets ($5M+), manages managers
Typical Duties: Strategic planning, organizational leadership, executive decision-making
Evaluation Process:
When evaluating a "Clinical Nurse Specialist" position:
Review the job description
Compare to grade descriptions
Note: Requires a Master's degree, 5 years of experience, makes clinical decisions, consults across departments
Too senior for Grade 5 (typical RN level)
Fits well with the Grade 7 description
Assign to Grade 7
Advantages:
Relatively quick - Faster than point factor once grades are defined
Easy to apply - Match jobs to descriptions
Good for consistent job families - Works well when you have many similar positions
Clear career paths - Employees can see progression through grades
Easier communication - Employees understand "Grade 5" descriptions
Standardized - Promotes consistency in job evaluation
Proven track record - Used successfully by government and large institutions
Disadvantages:
Rigid and inflexible - Hard to accommodate unique or hybrid roles
Grade creep risk - Pressure to slot jobs into higher grades over time
Doesn't show fine distinctions - Grade 5 may include jobs worth $50K-$75K
Initial setup challenging - Writing clear, comprehensive grade descriptions is difficult
Can limit innovation - New roles may not fit existing classifications
May not reflect market - Classification may not match market value differences
Subjective interpretation - Evaluators may disagree on best-fit grade
Best For:
Large organizations with many similar jobs (healthcare, education, government)
Highly structured, hierarchical organizations
Institutions needing clear, communicable levels
Organizations with strong internal promotion cultures
Public sector or regulated industries
Companies with 200+ employees and defined career ladders
Cost & Time Investment:
Setup: $10,000-$50,000 (consultant) or 150-300 internal hours
Timeline: 6-10 weeks initial implementation
Maintenance: 30-50 hours annually
Method 4: Market Pricing Method (External Equity Focus)
Overview: Market pricing determines job value primarily based on what other employers pay for the same or similar work. Rather than evaluating internal worth, you price jobs according to competitive market rates. This is increasingly popular in fast-moving, competitive labor markets.
How It Works:
Identify Benchmark Jobs - Select positions with clear market matches
Gather Market Data - Collect salary information from multiple sources
Match Jobs to Market - Compare your jobs to survey job descriptions
Analyze Data - Calculate 25th, 50th, and 75th percentiles
Set Pay Ranges - Build ranges around market rates
Price Non-Benchmark Jobs - Use benchmarks to estimate other positions
Make Policy Decisions - Decide market position (lead, meet, or lag)
Detailed Example:
A tech startup prices its software development jobs:
Step 1: Identify Benchmark Jobs
Software Engineer I (Junior Developer)
Software Engineer II (Mid-level Developer)
Software Engineer III (Senior Developer)
Engineering Manager
VP of Engineering
Step 4: Identify Compensable Factors
For the point factor method, select 4-8 factors that matter most to your organization. Common factors include:
Skill Factors:
Education and training required
Experience needed
Problem-solving complexity
Technical expertise
Responsibility Factors:
Supervisory responsibilities
Budget accountability
Impact on organizational outcomes
Decision-making authority
Effort Factors:
Mental demands
Physical demands
Stress level
Working Conditions:
Physical environment
Hazards or discomfort
Travel requirements
Step 5: Define Factor Degrees and Point Values
Create 3-5 levels for each factor with point values. Here's an example for "Education Required":
Degree 1 (20 points): High school diploma
Degree 2 (40 points): Associate degree or technical certification
Degree 3 (60 points): Bachelor's degree
Degree 4 (80 points): Master's degree
Degree 5 (100 points): Doctoral or professional degree
Weight factors based on organizational priorities. Technical companies might weigh "Technical Expertise" higher than "Physical Demands."
Step 6: Evaluate Benchmark Jobs
Start with 15-25 benchmark jobs that:
Represent different organizational levels
Are clearly understood
Exist in the external market (for salary surveys)
Are stable positions unlikely to change significantly
Have your committee independently score each job, then discuss and reach a consensus. This establishes the foundation for your structure.
Step 7: Conduct Market Research
Data Sources:
Salary surveys from professional associations
Compensation consulting firms (Mercer, Willis Towers Watson, Payscale)
Government data (Bureau of Labor Statistics)
Industry-specific surveys
Local chamber of commerce data
What to Collect:
Base salary ranges (25th, 50th, 75th percentiles)
Total cash compensation
Geographic location adjustments
Industry-specific data
Organization size comparables
Match your benchmark jobs to market data as closely as possible, adjusting for differences in scope or responsibility.
Step 8: Develop Your Salary Structure
Create Job Grades:
Plot your job evaluation points against market salary data on a scatter plot. You'll likely see a trend line emerge. Group jobs with similar point totals into grades, typically with 50-100 point spreads.
Example Grade Structure:
Grade 1: 0-100 points
Grade 2: 101-200 points
Grade 3: 201-300 points
And so on...
Establish Salary Ranges:
For each grade, create a range with three components:
Minimum: Entry-level pay for the grade (typically 80% of midpoint)
Midpoint: Market competitive rate for fully proficient performance (use 50th percentile market data)
Maximum: Pay for exceptional, sustained performance (typically 120% of midpoint)
Calculate Range Spread:
Range Spread = (Maximum - Minimum) / Minimum × 100
Common spreads:
Non-exempt/hourly jobs: 30-40%
Professional/exempt jobs: 40-50%
Management jobs: 50-60%
Executive jobs: 60-80%
Determine Range Progression:
The percentage increase between grade midpoints is typically 10-15% for most structures.
Step 9: Plot Jobs and Identify Issues
Place all evaluated jobs into the structure and identify:
Green-Circled Employees
“Underpaid relative to the job’s actual value”
A green-circled employee is someone whose current salary is below the appropriate pay range for the evaluated value of their job.
This means that:
Their job responsibilities, complexity, and contribution justify a higher pay grade.
The employee is not “cheap talent” — they are structurally underpaid, not performance-deficient.
This gap typically happens when:
the pay structure hasn’t been updated,
the job grew over time,
or market rates increased faster than internal adjustments.
Red-Circled Employees
“Overpaid relative to job value or pay grade”
A red-circled employee earns above the maximum of the salary range for their job’s evaluated value.
This means that:
The issue is not the person — it is the misalignment between pay and job value.
Often occurs due to:
legacy salaries from previous roles,
rapid structural changes,
long tenure without grade correction,
or past discretionary increases.
Compression Issues
Compression occurs when the pay differences between jobs, levels, or tenures become too small, even though the jobs should be meaningfully different based on job evaluation results.
Compression means “the salary structure has collapsed inward,” making it difficult to maintain fairness, motivation, or internal equity.
Types of Compensation Compression
1. New Hire vs. Tenured Employee Compression
New hires are brought in at salaries equal to or higher than long-tenured employees.
Happens when market rates rise quickly and the organization fails to adjust internal salaries.
Problem:
Long-tenured employees feel undervalued → morale drops → retention risk increases.
2. Supervisor–Subordinate Compression
Supervisors earn the same as—or sometimes less than— the employees they supervise.
Problem:
It undermines leadership roles and reduces motivation for employees to pursue higher responsibilities.
3. Grade Overlap/Structure Compression
Adjacent job grades have pay ranges that overlap too much, making the differences between grades meaningless.
Example:
Grade 6 max = 52,000
Grade 7 min = 51,500
(Only $500 difference → not a meaningful distinction)
Problem:
Job evaluation loses its purpose; career progression becomes unclear.
4. Performance Compression
High performers and low performers end up earning nearly the same, especially in weak pay-for-performance systems.
Address these systematically through your implementation plan.
Step 10: Develop Implementation Plan
Consider:
Budget impact and timeline for adjustments
Communication strategy
Transition policy for red/green-circled employees
Performance management alignment
Annual review and update process
Phase adjustments over time if needed, prioritizing the most critical inequities.
Real-World Case Study: TechStart Solutions
Let's walk through a complete example using a fictional mid-sized technology company.
Company Background
TechStart Solutions is a 150-employee software development company that has grown rapidly. They've never had a formal compensation structure, leading to pay inconsistencies and retention issues. Sarah, the new HR Director, has been tasked with creating their first structured approach.
Implementation
Step 1: Project Setup
Sarah formed a committee including:
Herself (HR Director)
CFO
VP of Engineering
VP of Sales
Director of Customer Success
Timeline: 3-month project with quarterly reviews thereafter.
Step 2: Job Descriptions
Sarah identified 45 distinct jobs across the organization. She interviewed managers and employees to update position descriptions and standardized the format.
Step 3: Evaluation Method
The committee chose the point factor method for its objectivity and the company's diverse job types (technical, sales, administrative, executive).
Step 4: Compensable Factors
They selected six factors important to TechStart (sample company):
Technical Knowledge/Skills (max 200 points) - 25% weight
Experience Required (max 160 points) - 20% weight
Problem Solving/Complexity (max 160 points) - 20% weight
Leadership/Supervisory Responsibility (max 120 points) - 15% weight
Impact on Business Outcomes (max 120 points) - 15% weight
Communication/Collaboration (max 40 points) - 5% weight
Total possible points: 800
Step 5: Factor Degrees
For "Technical Knowledge/Skills," they defined:
Degree 1 (40 pts): Basic computer literacy, learns on the job
Degree 2 (80 pts): Specialized technical training or certification
Degree 3 (120 pts): Bachelor's in a technical field, proficient in relevant tools
Degree 4 (160 pts): Advanced technical degree, expert-level specialized skills
Degree 5 (200 pts): Recognized expert, deep specialized knowledge, industry thought leader
Similar scales were developed for all six factors.
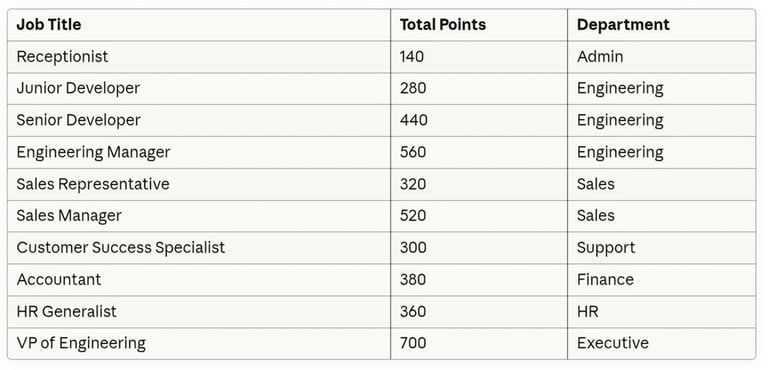
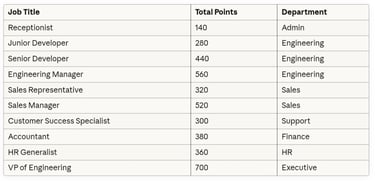
Step 6: Benchmark Jobs Evaluated
Sarah selected 18 benchmark jobs representing all departments:
The committee met for three half-day sessions to score these jobs, resolving disagreements through discussion.
Step 7: Market Research
Sarah purchased salary data from:
Dice Tech Salary Report (for technical roles)
Sales Management Association Survey
SHRM Compensation Data
Local technology council survey (for geographic adjustment)
She adjusted all data to their metropolitan area using a 0.95 cost-of-labor multiplier (5% below major tech hubs).
Market Data Examples (50th Percentile):
Junior Developer: $68,000
Senior Developer: $105,000
Engineering Manager: $135,000
Sales Representative: $75,000 (base + commission)
VP of Engineering: $175,000
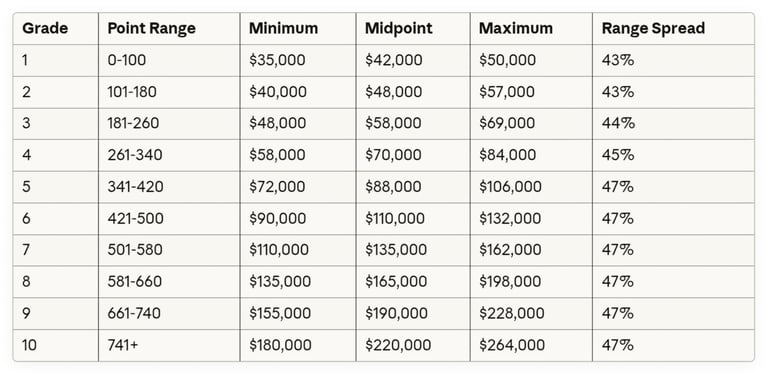
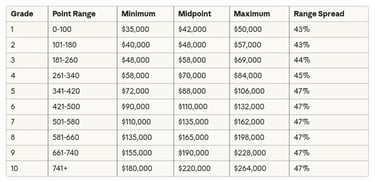
Step 8: Salary Structure Design
Sarah created a scatter plot of job evaluation points versus market salaries, which revealed a strong correlation. She designed 10 salary grades:
TechStart Solutions Salary Structure:
Midpoint progression: 12% on average
Step 9: Job Placement and Issue Identification
Sarah evaluated all 45 jobs and placed them in grades. She then compared current salaries to the new structure:
Issues Found:
Green-Circled (Underpaid):
8 employees below minimum (mostly long-serving administrative staff and some developers)
Average shortfall: $4,200
Total cost to bring to a minimum: $33,600
Red-Circled (Overpaid):
5 employees above maximum (early hires given equity + high salaries)
Average excess: $12,000
Plan: Freeze base, allow equity appreciation, shift compensation mix
Compression Issues:
Two senior developers making 5% more than their manager
Junior and mid-level developer pay overlaps significantly
Step 10: Implementation Plan
Budget Analysis:
Immediate adjustments for green-circled: $33,600
Compression fixes: $28,000
Market adjustments to retain key talent: $45,000
Total Year 1 investment: $106,600 (1.2% of payroll)
Timeline:
Month 1: Immediate adjustments for green-circled employees (presented as "equity adjustments")
Month 2-3: Address compression issues during normal review cycle
Ongoing: Red-circled employees receive no base increases until salary structure catches up (2-3 years)
Best Practices and Tips
1. Review Annually Markets change, jobs evolve, and inflation occurs. Review your structure at least annually and adjust midpoints in response to market movements.
2. Maintain Internal Equity. While market data is essential, don't abandon internal equity. A job that's 20% more valuable internally should typically pay 15-25% more.
3. Document Everything: Keep detailed records of your methodology, decisions, and rationale. This protects you legally and helps with future updates.
4. Train Managers. Your structure only works if managers understand and use it correctly. Provide training on making offers, positioning employees in ranges, and justifying pay decisions.
5. Stay Consistent. Don't make exceptions that undermine your structure. If someone must be paid outside the range, address why the job evaluation was wrong, not just the salary.
6. Communicate Appropriately. Decide what to share: Will employees know their range? Their grade? Just their individual salary? Be consistent in your transparency level.
7. Plan for Growth: Build flexibility for new roles, promotions, and organizational changes. Leave room in upper grades for expansion.
8. Consider Total Rewards. Base salary is just one component—factor in bonuses, equity, benefits, and non-monetary perks in your overall strategy.
Common Pitfalls to Avoid
Analysis paralysis: Don't spend six months perfecting a structure. Good enough is better than perfect
Copying others: What works for Google may not work for your 50-person startup
Ignoring culture: Your compensation philosophy should align with organizational values
One-time project: Compensation management is ongoing, not a one-and-done task
Hiding the structure: Excessive secrecy breeds distrust and speculation
Market-only focus: Pure market pricing ignores internal equity and can perpetuate discrimination
References and Citations
Gerhart, B., & Fang, M. (2015). Pay, intrinsic motivation, creativity, and performance of the R&D workforce. Academy of Management Journal, 58(5), 1341-1361.
Research on how compensation affects motivation and performance
Cited for: Internal equity considerations
Jensen, M. C., McMullen, K. R., & Stark, M. (2007). The use and misuse of public peer company multiples in compensation committees. Harvard Business School Working Paper, No. 08-056.
Research on market pricing methodology
Cited for: Market-based compensation approaches
Kilgour, J. G. (2008). Job evaluation revisited: The point factor method. Compensation and Benefits Review, 40(4), 37-46.
Comprehensive guide to point factor methodology, including compensable factors, committee composition, and managing red-circled/green-circled employees
Cited for: Point factor method advantages, green-circle and red-circle management
Koziol, W., & Mikos, A. (2020). The measurement of human capital is an alternative method of job evaluation for remuneration purposes. Central European Journal of Operations Research, 28(2), 589-599.
Alternative approaches to measuring job value
Cited for: Internal equity through job evaluation
Kutlu, A. C., Ekmekçioğlu, M., & Kahraman, C. (2013). A fuzzy multi-criteria approach to the point-factor method for job evaluation. Journal of Intelligent & Fuzzy Systems, 25(3), 659-671.
Advanced methodologies for factor weighting and scoring
Cited for: Objectivity in point factor systems
Rynes, S. L., Gerhart, B., & Minette, K. A. (2004). The importance of pay in employee motivation: Discrepancies between what people say and what they do. Human Resource Management, 43(4), 381-394.
Classic research on compensation and motivation
Cited for: Relationship between pay and performance
Trevor, C. O., Reilly, G., & Gerhart, B. (2012). Reconsidering the effect of pay dispersion on the performance of interdependent work: reconciling sorting and pay inequality. Academy of Management Journal, 55(3), 585-610.
Studies on internal pay equity and organizational performance
Cited for: Compression issues and pay differentials
Armstrong, M., & Taylor, S. (2020). Armstrong's Handbook of Reward Management Practice: Improving Performance Through Reward (6th ed.). Kogan Page Publishers.
ISBN: 9781398604117
7th edition (2023): ISBN 9781398611122
International perspective on compensation and job evaluation
Cited for: Job description best practices, internal equity balance
Henderson, R. I. (2006). Compensation Management in a Knowledge-Based World (10th ed.). Pearson Prentice Hall.
Classic text on job evaluation methodologies
Cited for: Legal defensibility of job evaluation systems, compa-ratio analysis
Martocchio, J. J. (2020). Strategic Compensation: A Human Resource Management Approach (10th ed.). Pearson Education.
ISBN: 9780135192146
Comprehensive compensation textbook
Cited for: Job evaluation definition and process, red-circle/green-circle strategies
Milkovich, G. T., Newman, J. M., & Gerhart, B. (2023). Compensation (14th ed.). McGraw-Hill Education.
ISBN: 9781264080908
Previous edition (2020): 13th ed., ISBN: 9781260043723
Industry standard for compensation professionals
Cited for: Job evaluation definition, market positioning strategies, and conclusion
WorldatWork. (2019). The WorldatWork Handbook of Compensation, Benefits & Total Rewards: A Comprehensive Guide for HR Professionals. Wiley.
Practical guide from leading compensation association
Cited for: Compensable factors selection (4-8 factors), benchmark job selection (15-25 positions), total rewards strategies
WorldatWork & Deloitte Consulting LLP. (2012). Salary Structure Policies and Practices Survey. WorldatWork.
Survey of 910 organizations on salary structure design practices
Key findings on range spreads and midpoint progressions
Cited for: Range spread standards (30-80%), midpoint progression benchmarks (10-15%)
AIHR (Academy to Innovate HR). (2024, August 28). What is the point factor method? HR Glossary.
Comprehensive overview of point factor methodology
Cited for: Point factor method overview, paired comparison variations, transparency benefits
AIHR (Academy to Innovate HR). (2024, April 1). Job evaluation: Your 2026 guide [+ Free template].
Complete guide to job evaluation methods and implementation
Cited for: Job evaluation methods comparison, Hay system references
CompTool. (2024, February 5). A guide for creating a salary structure.
https://comptool.com/a-guide-for-creating-a-salary-structure/
Technical guide to salary structure design
Cited for: Midpoint progression standards, compression management, implementation considerations
Economic Research Institute (ERI). (2024, August 21). Common compensation terms & formulas - Updated July 2024.
https://www.erieri.com/blog/post/common-compensation-terms-formulas
Definitive glossary of compensation terms and calculations
Cited for: Range spread formulas and standards (30-80%), midpoint progression ranges (5-20%)
Gradar. (2025). Job evaluation methods: Point factor systems.
Point factor system consistency and applications
Cited for: Consistency across diverse jobs
Maini, N. (2024, February 26). Step-by-step guide on how to conduct a job evaluation exercise using the point factor method. Medium.
Practical implementation guide
Cited for: Customization of point factor systems
SalaryCube. (2025). Job classification systems: Government and corporate applications.
Classification method implementation
Cited for: Job classification approach overview
Synergogy. (2025, August 18). Job evaluation using the point factor.
Practical guide to point factor implementation
Additional resource on the four major factors
University of Waterloo, Human Resources. (2025). Hay job evaluation system overview.
Documentation of Hay method factors
Cited for: Hay's method: three primary factors (Know-How, Problem Solving, Accountability)
Workology. (2024). Job ranking method: Simple approaches to job evaluation.
Overview of ranking methods
Cited for: Job ranking method simplicity
Hastings, R., & McCord, P. (2009). Netflix Culture: Freedom and Responsibility. Netflix.
Netflix compensation philosophy documentation
Cited for: Market-based pricing approach, top-of-market positioning
Levels. fyi. (2021). Netflix compensation data and analysis.
Market positioning evidence and analysis
Cited for: Netflix 90th percentile positioning verification
LinkedIn. (2023). Global talent trends: Compensation and benefits.
Annual compensation review recommendations
Cited for: Annual structure review best practices
Netflix. (2024). Compensation philosophy and practices.
Current compensation approach documentation
Cited for: Individual job pricing, market adjustment practices
Peoplebox. (2025). The Hay method: Understanding point-factor job evaluation.
Hay system global usage
Cited for: Hay method as the most widely used point-factor system
U.S. Department of Labor. Fair Labor Standards Act (FLSA) Regulations.
Wage and hour requirements
Cited for: Compliance requirements
U.S. Equal Employment Opportunity Commission (EEOC). Equal Pay Act Guidelines.
Equal pay compliance requirements
Cited for: Legal compliance in job evaluation
Uniform Guidelines on Employee Selection Procedures. (1978). Federal Register, 43(166), 38290-38315.
Legal framework for job evaluation and classification
Cited for: Documentation standards
Korn Ferry Hay Group. (2017). Job evaluation: Foundations and applications. Korn Ferry.
https://www.kornferry.com/content/dam/kornferry/docs/pdfs/job-evaluation.pdf
Comprehensive guide to Hay methodology
Background reference on established evaluation systems